Destination Weddings & Honeymoon Report: Wedding and Honeymoon Statistics
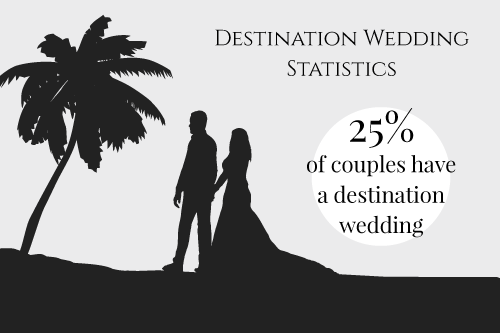
A total of 340,000 destination weddings take place every year, comprising 25% of all marriages.
In Ampersand Travel’s comprehensive Destination Weddings and Honeymoon Report we have dug into all of the facts and figures you need to know about weddings at home and abroad, honeymoons, engagements, and everything else in between.
Destination Wedding Statistics
How many people get married abroad?

Opting to marry abroad is a popular choice for many couples.
- 25% of marriages take place abroad
- 340,000 destination weddings take place each year
- The destination wedding market accounts for $16 billion in annual spending
Why do people get married abroad?
Not too surprisingly, one of the key reasons couples get married abroad is the hope of good weather, with many couples jetting off to sunnier climes.
- 9 out of 10 couples say the weather is a key factor in selecting a destination
Which couples are most likely to get married abroad?
It would appear destination weddings are a common choice for couples who are slightly older or are getting married for the second time. Couples who choose a destination wedding are also likely to be wealthy with a sizeable budget for their wedding.
- 80% of couples who choose a destination wedding have been married previously
- On average, the age of brides choosing a destination wedding is 33 – older than the typical US average
- 70% of couples who have a destination wedding are college graduates and have an average household income of $110,000
Eloping is also popular for laid-back couples who are looking for a low-key affair with a more intimate sized group of family and friends.
- Destination weddings have an average guest list of just 48 people
Most popular destination wedding locations
The most popular locations for destination weddings are:
- Las Vegas
- Hawaii
- S. Virgin Islands
- Jamaica
- Bahamas
- Mexico
- California
- Florida
How much do people spend on a destination wedding?
Destination weddings are certainly not a budget affair, and couples are prepared to splash the cash when it comes to their dream destination wedding.
- On average a destination wedding costs $28,000
- 60% of couples fund their own destination wedding
- On average it costs guests $673 to attend a destination wedding
Honeymoon Statistics
How much to spend on a honeymoon?

For some couples, the honeymoon may be even more exciting than the wedding itself. Whether it’s soaking up the sun on a paradisiacal beach or trekking a mountainous landscape on a newlywed adventure, for most couples their honeymoon is the most special holiday they will ever take together, meaning they are happy to spend big.
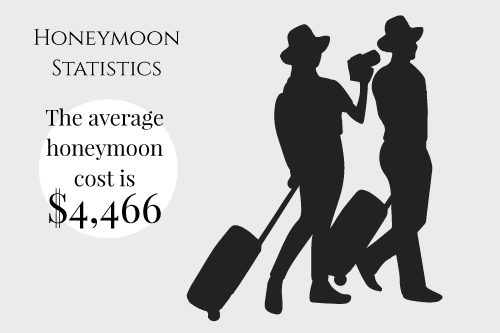
- The average honeymoon cost is $4,466
- Couples spend 3x as much on their honeymoon as what the average US adult spends on a regular holiday
- Honeymoons form a $12 billion-dollar-a-year industry
- The honeymoon typically accounts for 14% of the wedding budget
- 62% of couples fund their own honeymoon
Average honeymoon length
Some couples choose to enjoy a mini-moon before or instead of a longer honeymoon, while other couples decide to jet off on a full month of honeymoon travels.
- The average honeymoon length is 8 days
- 15% couples have a minimoon and a honeymoon
Most popular honeymoon destinations
The most popular honeymoon destinations include:
- Hawaii
- Caribbean
- South Pacific
- Mexico
- Jamaica
- Bahamas
- Italy
- France
- S. Virgin Islands
Different types of honeymoon
The dream honeymoon varies for every couple – some couples can think of nothing better than a traditional romantic honeymoon on a beautiful remote island, while alternative honeymoons such as city breaks, adventure holidays and safaris are also popular choices.
- 10% of couples choose a cruise for their honeymoon
- Pinterest saw a 219% increase in safari honeymoon ideas in 2018
- Surfing honeymoons also proved popular on Pinterest in 2018
- Pinterest activity shows that Switzerland is a popular choice for honeymooners planning a ski vacation
Honeymoon trends
4 million US couples honeymoon each year
- 99% of couples who plan a traditional wedding will take a honeymoon
- Honeymoons are typically booked 4 months prior to the wedding
- Only 25% of newlyweds will go on their dream honeymoon
- Social media is a popular way of researching honeymoon locations with 80% of couples using social media to help pick their honeymoon destination over the last 5 years
- 1% of couples buy new clothes for their honeymoon
Wedding Statistics
Wedding planning

When it comes to weddings, the planning can be the most exciting – and the most stressful – element. From venues to colour schemes, table plans and entertainment there’s so much to consider.
- 2/3 millennials start planning their wedding before getting engaged, including looking at wedding dresses and researching venues
- 40% of couples start planning their wedding less than 1 month after getting engaged
- The first steps couples take when planning their wedding are setting a date, researching venues and planning a budget
- 27% of engaged couples hire a wedding planner
- On average the bride does 54% of the wedding planning while the groom does 25%
- The couple’s parents typically take on 14% of wedding planning
- Couples spend almost 2 hours each week wedding planning
- 52% of couples incorporate a theme into their décor
- The most popular wedding theme is rustic/woodland, used in 16% of weddings
- 22% couples use the location where they met or grew up as inspiration for their wedding theme
- 1 in 5 couples incorporate cultural elements into their ceremony
- 14% of couples say their wedding theme is unusual
- Just over 1/5 of couples have no theme to their wedding
- The most popular wedding colour scheme is white/ivory, chosen by 74% of couples
- 79% couples use their wedding colours in their flower arrangements
- 61% of couples make their own favours and 49% make their own decorations
- 40% of couples bake their own wedding cake
- 44% couples write their own vows
Wedding costs statistics
Planning a wedding on a budget is no easy feat and the average couple will spend over $30k on hosting their dream day. Couples typically underestimate how much they will spend on their wedding and end-up going over budget – with changes to the guest list, personalised options and upgrades, all being reasons which couples cite for going over-budget.
- $35,329 is the average amount spent on a traditional American wedding
- The average cost per wedding guest is $268
- Guests spend an average of $703 to attend a wedding
- On average couples underestimate their wedding spend by nearly 45%
- 1 in 3 couples say their initial budget is not always realistic and acts as a starting-point
- Couples typically contribute 45% of the wedding fund, with parents contributing 46%
- 32% of couples pay for their own wedding in full
- 19% of brides’ parents pay for the full wedding
- 15% of couples share the cost of the wedding between both sets of parents
- Weddings paid for by the couple are approximately $8k cheaper than weddings paid for by parents
- On average Millennials spend $10,000 more than Gen X on their wedding ceremony and reception
- Couples typically spend around 50% less on a second wedding than a first wedding
- The venue accounts for the highest wedding expense, at an average cost of $9,000
- The average spend on wedding catering is $6,700
- Other key wedding expenses for couples include:
- Band - $3,900
- Photography - $2,400
- Wedding rings - $1,900
- Wedding planner - $1,850
- Rehearsal dinner (+additional meals) - $1,800
- Videography - $1,800
- Flowers - $1,800
- Event rentals & photobooths - $1,700
- Lighting & décor - $1,200
- DJ - $1,200
- Transportation - $1,050
- Wedding party attire - $800
- Hair & make-up - $650
- Ceremony music - $600
- Wedding party gifts - $600
- Invitations/stationery - $550
- Cake/desserts - $550
- Beauty & health - $550
- Favours & gifts - $450
- Groom’s attire - $400
- Jewellery - $300
- Registrar - $300
Most popular wedding months
The most popular months for weddings to take place are, in this order:
- October
- September
- June
- August
- May
- July
- December
- November and April
- February
- March
- January
- The most popular months for weddings are September and October
- 40% weddings take place in autumn
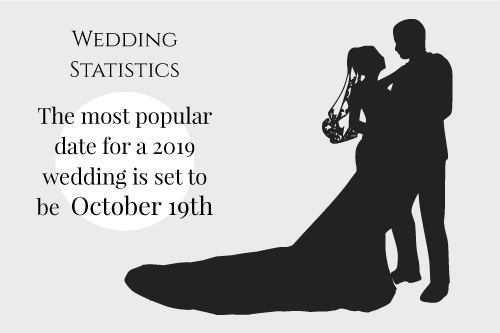
- October 19th is set to be the most popular wedding date in 2019
How many weddings take place each year
Multiple weddings take place every day, with over 2 million weddings take place each year in the US alone.
- Each weekend an average of 44,230 weddings takes place
- 88% of Americans marry at least once in their lifetime
- Every year an average of 2.4 million weddings are performed in the US
Wedding guests
Deciding on your guest list can be one of the most difficult parts of wedding planning, with tough decisions having to be made on whether to invite long-lost relatives, plus ones, and babies. The average wedding has a rather large guest list of over 100.
- The average number of wedding guests is 136
- Asian weddings tend to have more guests with an average guest list of 219
- 23 million people take on the role of bridesmaids and groomsmen each year
- 23% brides have 5 or more bridesmaids
- The average number of people in a wedding party is 10
- 60% couples have a ring bearer and/or flower girl
- 34% couples have a mixed gender wedding party – such as male bridesmaids
Wedding dresses
For the bride, the wedding dress may well be something they have dreamed about their whole life, and it usually takes more than one shopping trip to find the one. On average, it’s a case of third time lucky with most brides finding their dress of choice in the third bridal boutique they visit.
- 78% brides buy a wedding dress
- The average amount spent on a wedding dress is $1,564
- Brides typically visit 3 bridal shops before finding their dream dress
- Suits are typically purchased 5-6 months after the wedding dress
- Bridesmaids' gowns are generally purchased 3-4 months before the wedding
- An increasing number of bridesmaids wear different dresses, with 63% mixing it up
Wedding venues
Where to say ‘I do’ is one of the first, and the most important, questions which couples ask when planning their nuptials. With traditional religious weddings on decline there is a myriad of unique wedding venues to choose from – whether it’s a castle, manor house, barn or something else entirely.
- 86% couples hire a wedding venue
- Only 33% of weddings take place in a religious institution
- 20% couples choose to get married in a hotel
- A country/manor house is the choice of venue for 18%
- Barns account for 13% of wedding venues
- Only 5% couples choose to marry in the local register office
- Castles are a surprisingly unpopular choice of venue, attracting just 3% of couples
Wedding registry
With many couples already living together before marriage, it is now increasingly common for newlyweds to simply ask for cash for a wedding gift rather than the traditional household utensils.
- Over 91% of couples register for wedding gifts
- $19 billion is spent on presents from wedding gift registries
- More than 50% of couples ask for cash as a wedding gift
What happens on the wedding day?
Every wedding is special and unique, but certain trends and traditions remain popular – including music from a DJ or live band and wedding favours for the guests. Photobooths are also now a common choice for weddings, with a quarter of couples choosing to capture moments from the day with a pop-up photobooth.
- Saturday is the most popular day to get married, followed by Friday
- Monday is the least popular day for a wedding
- 65% of couples get ready with their wedding party
- 70% of ceremonies last 30 minutes or less
- 43% of wedding ceremonies are conducted by a friend or family member
- 64% ceremonies feature a reading
- 47% couples give a speech during their reception
- 13% couples hire a toastmaster for their wedding
- 1 in 4 couples have their first dance to a country song
- 76% of wedding receptions include an open bar
- 28% weddings feature a signature cocktail
- 24% weddings provide an evening buffet or snacks
- 18% weddings include an interactive food station
- 69% of couples provide guests with wedding favours
- Food-themed favours are the most popular type of wedding favour
- 71% of couples hire a DJ, while 47% hire a live band/musician
- 25% couples have a photobooth at their wedding
- 15% couples hire unique entertainment
- 14% provide transport for their guests
- One quarter of couples have a post-wedding after party
Wedding industry statistics
With big bucks being spent by couples on their weddings, the wedding industry is thriving with plenty of lucrative opportunities for vendors. An increase in artsy and rustic themes also opens up a whole new host of opportunities for creative wedding vendors.
- The wedding industry is worth $50 billion annually
- Couples typically hire 14 different vendors for their wedding day
- Nearly 80% couples rely on user reviews when selecting wedding vendors
- Price is ultimately the most important factor when choosing a wedding vendor
- A photographer is the most popular wedding vendor, hired by 90% of couples
- 80% brides-to-be hire a professional for their hair and make up
- Over 75% couples order a professionally baked cake
- 74% couples use a professional florist service
Weddings in the digital age
As technology plays an ever-bigger role in our daily lives, it is inevitably creeping into the world of weddings – from couples creating wedding hashtags, to online invitations, bespoke wedding sites to keep guests updated, and some couples even updating their Facebook status on their wedding day.
- 30% of millennials create a Pinterest wedding inspiration board before getting engaged
- 80% of wedding planning is done online
- 39% couples conduct wedding research using their smartphone
- Almost 3/4 couples set up a wedding website for communicating with guests
- 66% use an app to help plan their wedding
- 64% couples turn to Pinterest for wedding inspiration
- 54% of couples utilise online RSVPs
- 53% couples create a wedding hashtag
- 35% of people update their relationship status online within 24 hours of getting engaged
- 21% don’t update their relationship status online at all after getting engaged
- 2% couples update their relationship status online during the wedding ceremony
- Las Vegas is the most popular honeymoon ‘check-in’ on Facebook
Wedding search trends
The increasing role of technology, also provides interesting insight into the key questions couples are asking about their wedding. This is what couples are searching for.
The top 10 wedding search terms are:
- Wedding planner (or planning)
- Wedding checklist
- Christmas wedding planner
- How to plan a wedding
- Wedding venue near me
- Wedding timeline
- Wedding planning timeline
- Wedding budget
- Wedding planners near me
- Wedding coordinator
Wedding traditions
With every generation new elements are added and removed from the typical wedding, but which traditions are holding true and which are fading out?
- 67% ask for the parents’ blessing before proposing
- In 82% of weddings at least one of the couple wore white
- 77% fathers escort the bride – or groom – down the aisle
- 92% couples have a first dance
- 80% brides intend to change their name
- 3% of brides intend to sign a prenuptial agreement
Engagement Statistics
Proposal statistics

Before any concrete wedding planning can begin, the big question has to be asked. So where, when and how are couples popping the question.
- 75% get down on one knee when proposing
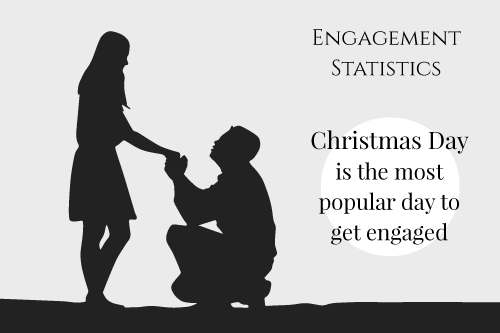
- Christmas Day is the most popular day to get engaged
- 10 of the most popular engagement dates are in December
- 19% engagements happen in December
- 31% of proposals take place at home
- 26% proposals involve friends and family
- 11% women propose to men
Length of engagements
Most couples are engaged for over year, allowing time for wedding planning – though some keen and organised couples turn it all around in as little as 3 months.
- The majority of couples are engaged for more than 1 year
- The average engagement lasts 14 months
- 5% couples plan their wedding within just 3 months
- 13% of engagements don’t actually result in a wedding
During the engagement period, couples buy:
- $4 billion in furniture
- $3 billion in housewares
- $400 million in tableware
Engagement ring statistics
With engagement rings playing an important part in what is a very special moment in a couple’s relationship, picking the right engagement ring is a major decision – and many loved up beaus are spending thousands on the perfect ring for their love.
- The average spend on an engagement ring is $5,000
- The average cost of diamond engagement ring is $6,163
- 71% rings have diamond as main stone
- 1 in 3 brides help pick their own engagement ring
- 50% of proposers purchase the engagement ring over 2 months before the proposal
- 50% buy engagement ring from a ‘brick-and-mortar’ store
- The average amount spent on wedding rings for the couple is $1,575
Couples’ journey to marriage
Every couple has their own love story - these are some insights into the relationship journeys which bring newlyweds to their big day.
- 55% couples date for more than 2 years before getting married
- The average couple is together 4 years before marriage
- 2% couples get engaged within 6 months of being together
- 23% of married couples met through a friend
- 72% couples live together before getting married
- Only 54% couples discuss their finances before getting married
- 35% of newlyweds owned a pet together before getting wed
- 26 is the most popular age to get engaged
- The median age for first-time brides is 29, while for grooms it's 31
- The median age for a second marriage is 34 for brides and 37 for grooms
- One-third of brides and grooms have been married previously
- Nearly 60% of couples marry someone with a different background
- 22% of newlyweds grew up in different regions
- 18% of married couples have different religious beliefs
- 17% of couples are of different ethnicities from each other
- 15% of couples are of different races
Sources
https://www.tripsavvy.com/wedding-statistics-and-honeymoon-facts-1860546
https://go.weddingwire.com/newlywed-report
https://www.confetti.co.uk/wedding-news/uk-wedding-statistics-2017
https://www.hitched.co.uk/wedding-planning/organising-and-planning/wedding-survey-2017/
https://www.trekksoft.com/en/blog/65-travel-tourism-statistics-for-2019
https://www.dailymail.co.uk/travel/travel_news/article-2770562/World-s-honeymoon-destinations-according-Facebook-The-popular-romantic-spots-newlyweds-check-revealed-not-one-Europe.html


